Introduction
FigTree is a user-friendly software to visualize phylogenetic trees. To undertake this tutorial, you will need to download the FigTree latest software package version that is compatible with your computer system (available for Mac OS X, Windows and Linux/UNIX operating systems).
Running FigTree
Run FigTree by double-clicking on its icon. FigTree is an interactive graphical application for visualizing phylogenetic trees.
Exercise 1 – Visualizing Cross-Border Transmission of Ebola virus during the 2014-2016 West Africa Epidemic
Summary: This tutorial provides a step-by-step guide to visualize an Ebola virus timetree generated from 1610 sequences that have been collected at different time points. These sequences represent 5% of the known cases. The data has been used to elucidate the factors driving the spread and persistence of the Ebola epidemic in Dudas et al. Nature 2017. The aim of this exercise is to visually identify cross-border virus movement between West African countries, and identify the date of emergence of the main Ebola virus lineages in particular countries. The files for this tutorial include a timetree in newick format with 1610 tips and a corresponding metadata file. The metadata file includes:
- Taxa: name of the taxon (identical to the timetree)
- Country: country of sampling
- Location: province of sampling
- Latitude: latitude of the province centroid
- Longitude: longitude of the province centroid
- Collection_date: date of collection of the taxa (dd/mm/yyyy)
Loading a tree and metadata
To load a phylogenetic timetree, select the Open... option from the File menu and browse the “west-african-ebola.tre” to load it. Alternatively, by double-clicking on phylogenetic tree files with extension .tree and .tre, these will open directly on FigTree. Once loaded, the tree will be shown in Figtree. To load metadata files (tab-delimited files), select the Open... option from the File menu, Import Annotations. Browse the “west-african-ebola.metadata.txt” to load the metadata file.
In this tutorial, we will investigate the cross-country movement of the Ebola virus in West Africa. In the Tree menu, select the “Country” attribute using Annotated nodes from tips.
Tree Layouts
The Layout sidebar menu on the left allows the user to select three layout options: rectangular, polar, and radial format trees. Polar layouts (or circle trees) use polar coordinates. The vertical dimension is now the angle of the circle and the horizontal dimension is the distance from the centre point. These tree formats are often used to make a big visual impact in papers but generally have reduced readability - it is difficult to compare how far nodes are from the centre. They are best avoided. Radial layouts are not commonly used and are more appropriate when the rooting of the tree is not known. This format tends to clump closely related sequences together making their precise relationships difficult to see. We strongly recommend the tutorial How to read a phylogenetic tree that will guide you on how to interpret your phylogenetic tree in a rectangular format.
Other options on the Layout sidebar menu include to Zoom in particular clades, and Expansion, particularly useful for zooming in on larger trees. You can also use the option Align Tip Labels to improve clarity.
Tree rooting
The Trees sidebar menu allows the user to Root tree (according to user selection or midpoint rooting), Order nodes (increasing or decreasing), and Transform branches (equal branch lengths, proportional branch lengths, and cladogram). Since the west-african-ebola.tre was estimated assuming a molecular clock, it implicity assumes a time scale.
Adding a timescale
The scale beneath the timetree will be expressed in the average number of substitutions per time unit. To add a time axis, select the sidebar menu Time Scale. The most recent sampling date of this dataset is 26/09/2015, which corresponds to 2015.735 in decimal units. Select the option Scale by factor and set Offset to 2015.735 (the most recent sampling date of this tree).
For trees that are not calibrated in time units, the option Scale factor can be used to produce a Scale Axis in terms of the number of substitutions. In this case, Scale factor in the Time Scale sidebar menu should be defined as the number of base pairs in the alignment used to build the tree.
The sidebar menu Scale Axis allows the user to specify Label spacing, Tick spacing, Origin value, and Font Size. It also includes options to Show grid and Reverse axis. From the Scale Axis sidebar menu, select the option Reverse axis. Among other options such as Label spacing and Tick spacing, the user can also increase Font Size to, for example, 12.
The sidebar menu Scale Bar allows the user to specify a scale bar for the phylogenetic tree, along with a Font Size and Line Weight. For clarity, you can untick the Tip Labels and Scale Bar side menus for now, and increase Size to 8 in the Tip Shape side menu.
Adding a discrete attribute to phylogenetic tips
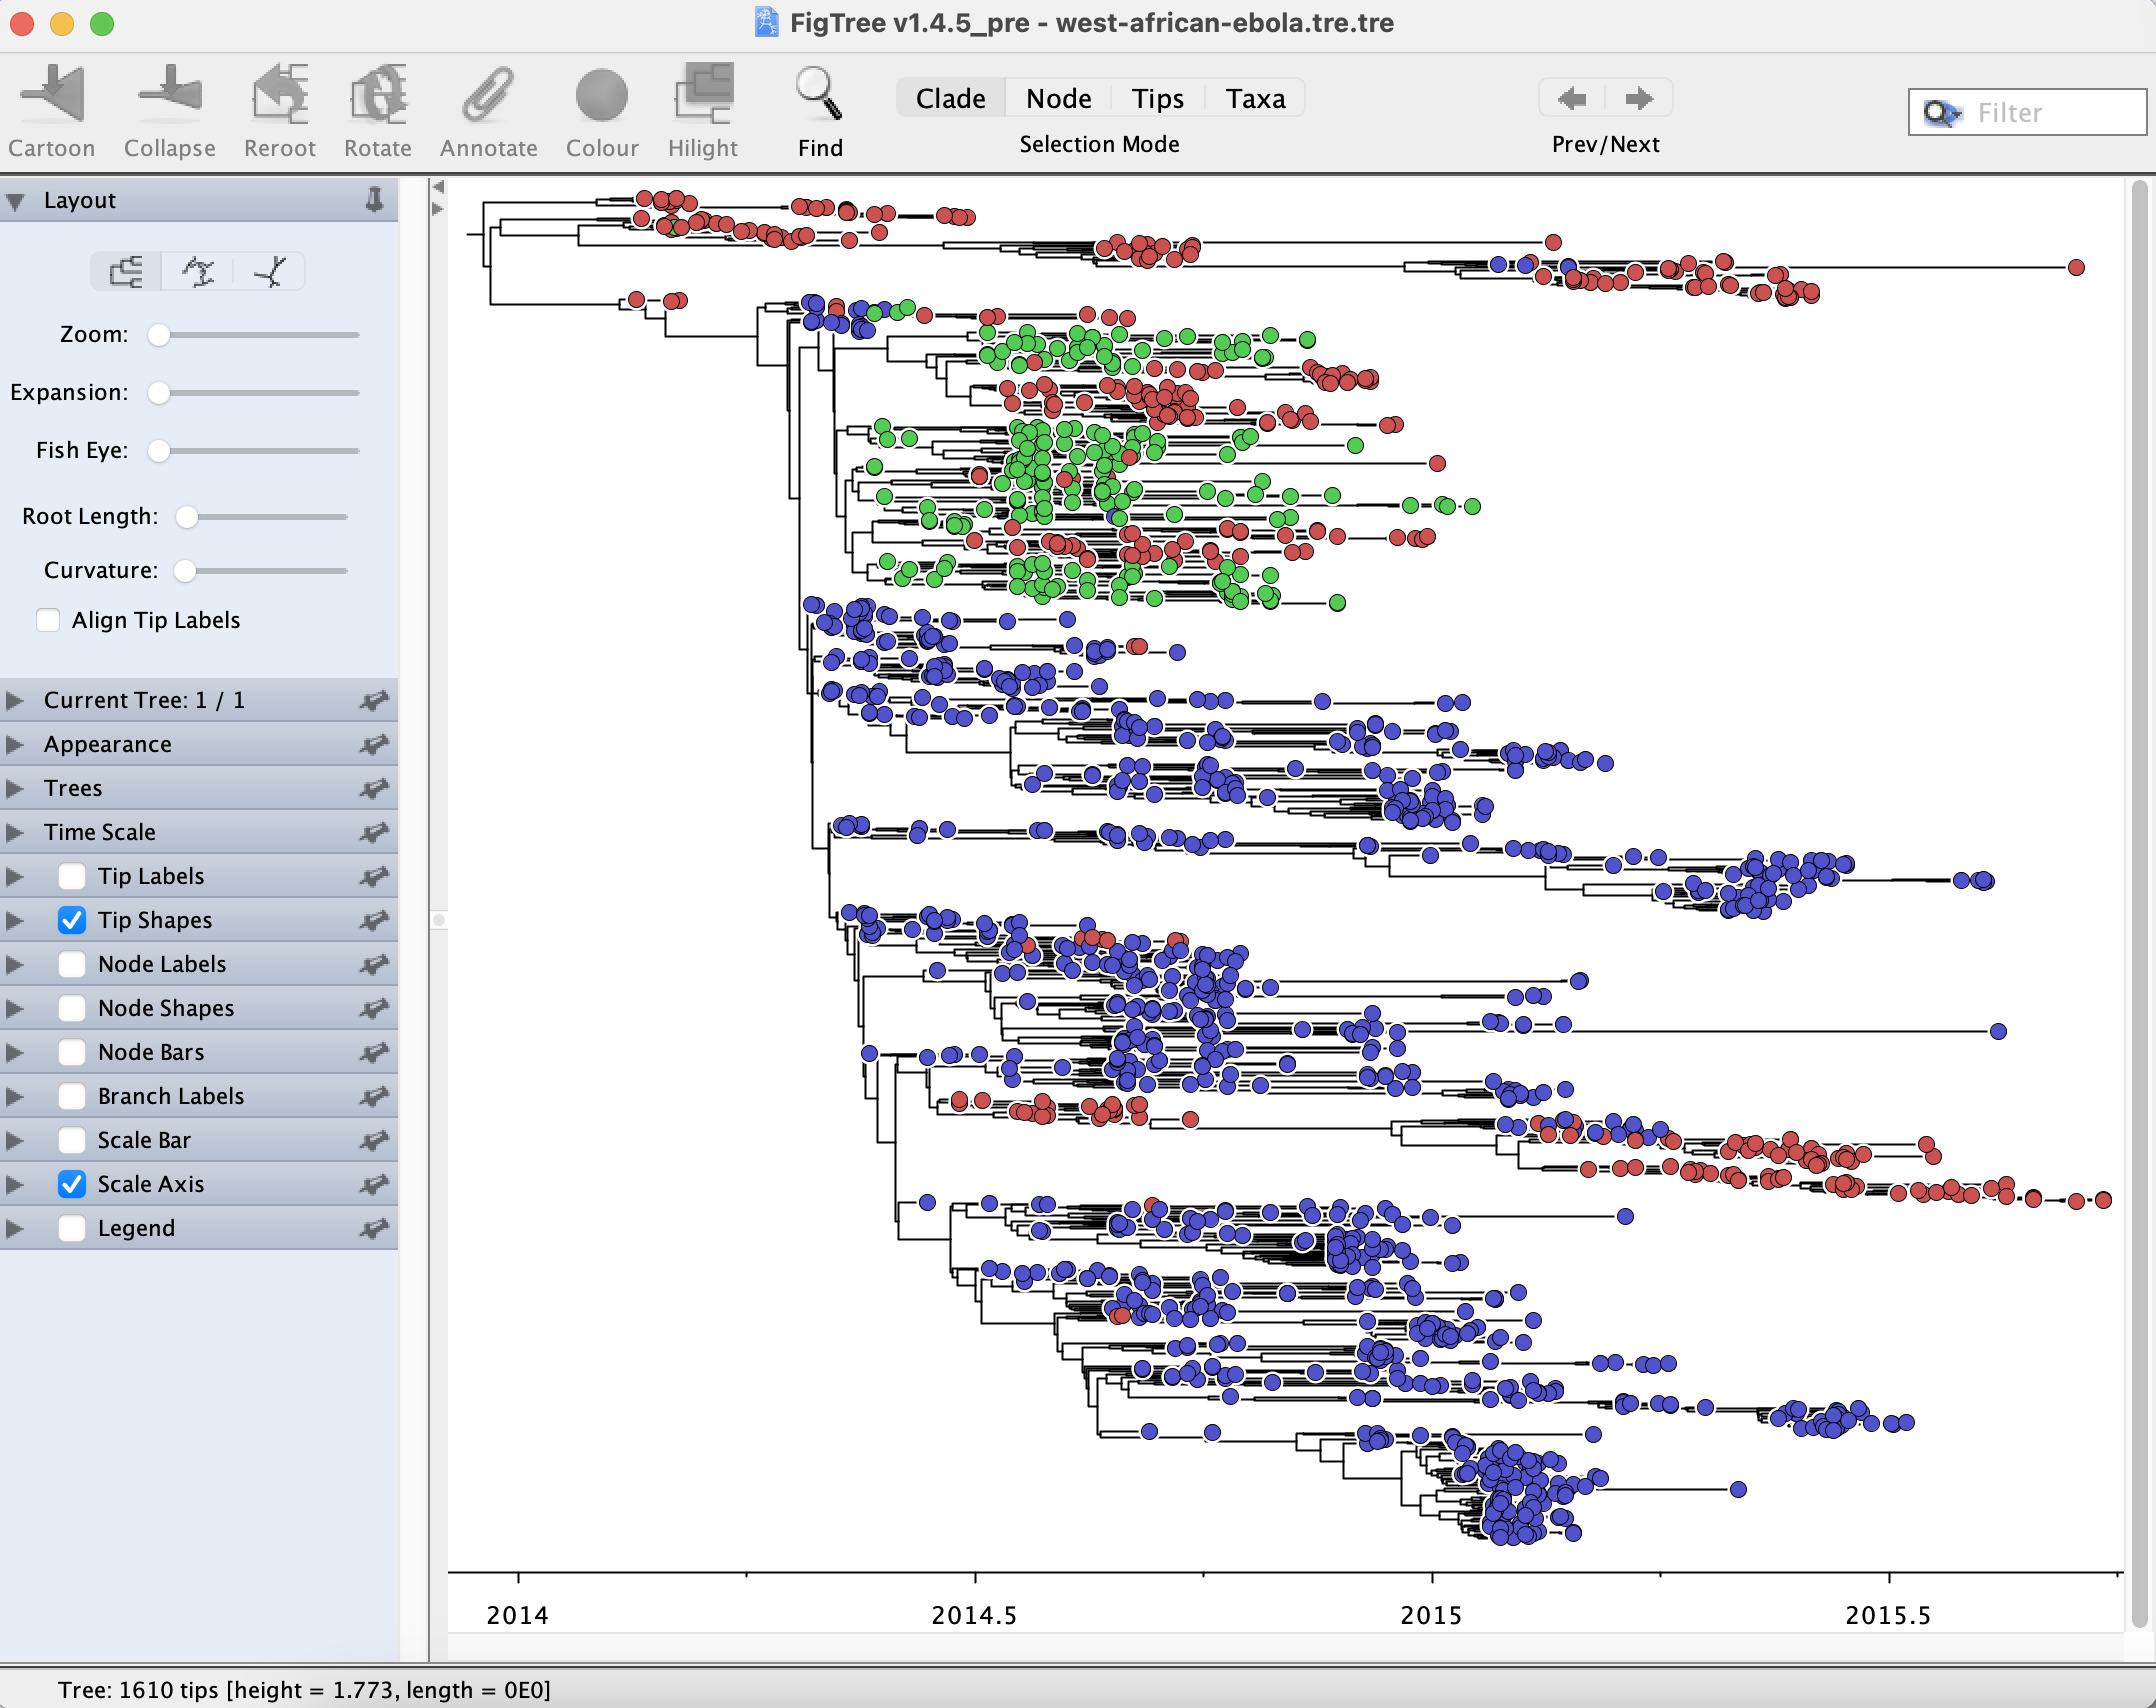
In the sidebar menu Tip Labels, the user can select different options on how to Display tips and Colour by tip names or any discrete or continuous metadata contained in the tab-delimited file uploaded using the option Import Annotations from the File menu. It also includes several options to set up Font size, Font type, and define specific tip Colour.
In the sidebar menu Tip Shapes, you can select the shape (as a circle, rectangle, or diamond) and also select the colour tips according to discrete or continuous metadata contained in the metadata tab-delimited file. First, you need to select a specific metadata attribute, in this case, “Country”. Since attributes are assigned by default to tips, but not no nodes, we need to select the “Country” attribute using Annotated nodes from tips from the Tree menu. Once the “Country” attribute is selected, there are a range of options for colouring and setting up Tip Shape for that attribute. Now, in the sidebar menu Legend, select “Country”.
The sidebar menu Node Labels allows the user to Display internal node labels such as Node ages and Branch times. As the “Country” attribute has been selected, the user can also display “Country” at internal nodes throughout the phylogeny. Ancestral attributes are inferred using parsimony from any discrete metadata attribute that has been previously selected using Annotated nodes from tips from the Tree menu. Parsimony is the reconstruction that requires the fewest jumps between countries. The Colour by option in the sidebar menu Node Labels allows users to colour internal nodes according to inferred discrete attributes.
The sidebar menu Node Shapes is similar to the Tip Shapes menu but for internal nodes. In the Node Shapes sidebar menu, the user can set up Size by: posterior and adjust Min size and Max size so that internal node shapes are sized proportionally to, for instance, posterior probably support. The user can also define the Outline width and the Outline colour of the node shape.
The sidebar menu Node Bars allows the user to visualize the highest posterior density intervals associated with uncertainty for node heights in a BEAST timetree. The user can also specify the Bar Width.
The sidebar menu Branch Labels is similar to the Node Labels option and allows the user to Display and Colour branch labels, including branch times, node ages or ancestral attributes inferred using parsimony from any discrete metadata attributes that have been previously selected using Annotated nodes from tips from the Tree menu.
The sidebar menu Legend allows the user to include a legend for any continuous or discrete metadata attributes that have been previously selected using Annotated nodes from tips from the Tree menu.
Obtaining a subtree for a clade of interest
To select all taxa from Sierra Leone, select the Tip Labels option on the left sidebar menu. Using the Find menu at the top right-hand side, type “|SLE|”. This option will select all taxa sampled in Sierra Leone. For this exercise, we are interested in the larger SLE clade only. Click on the Clade option from the menu above, and select the ancestral branch leading to the larger SLE clade, as pictured below:
To generate a subtree of this clade for further investigation, simply press Command + C, followed by Command + N to open a new FigTree window, and Command + V to paste the subtree. You can also use the main Edit “Copy”, File “New”, and Edit “Paste” options. The new tree should have 1122 tips. Now repeat the steps above to add a time axis to the new tree, taking into account its most recent sampling date.
How many reintroductions have there been in Guinea, how many descendants have each introduction generated, and when have these introductions occurred?
Saving a tree as a PDF
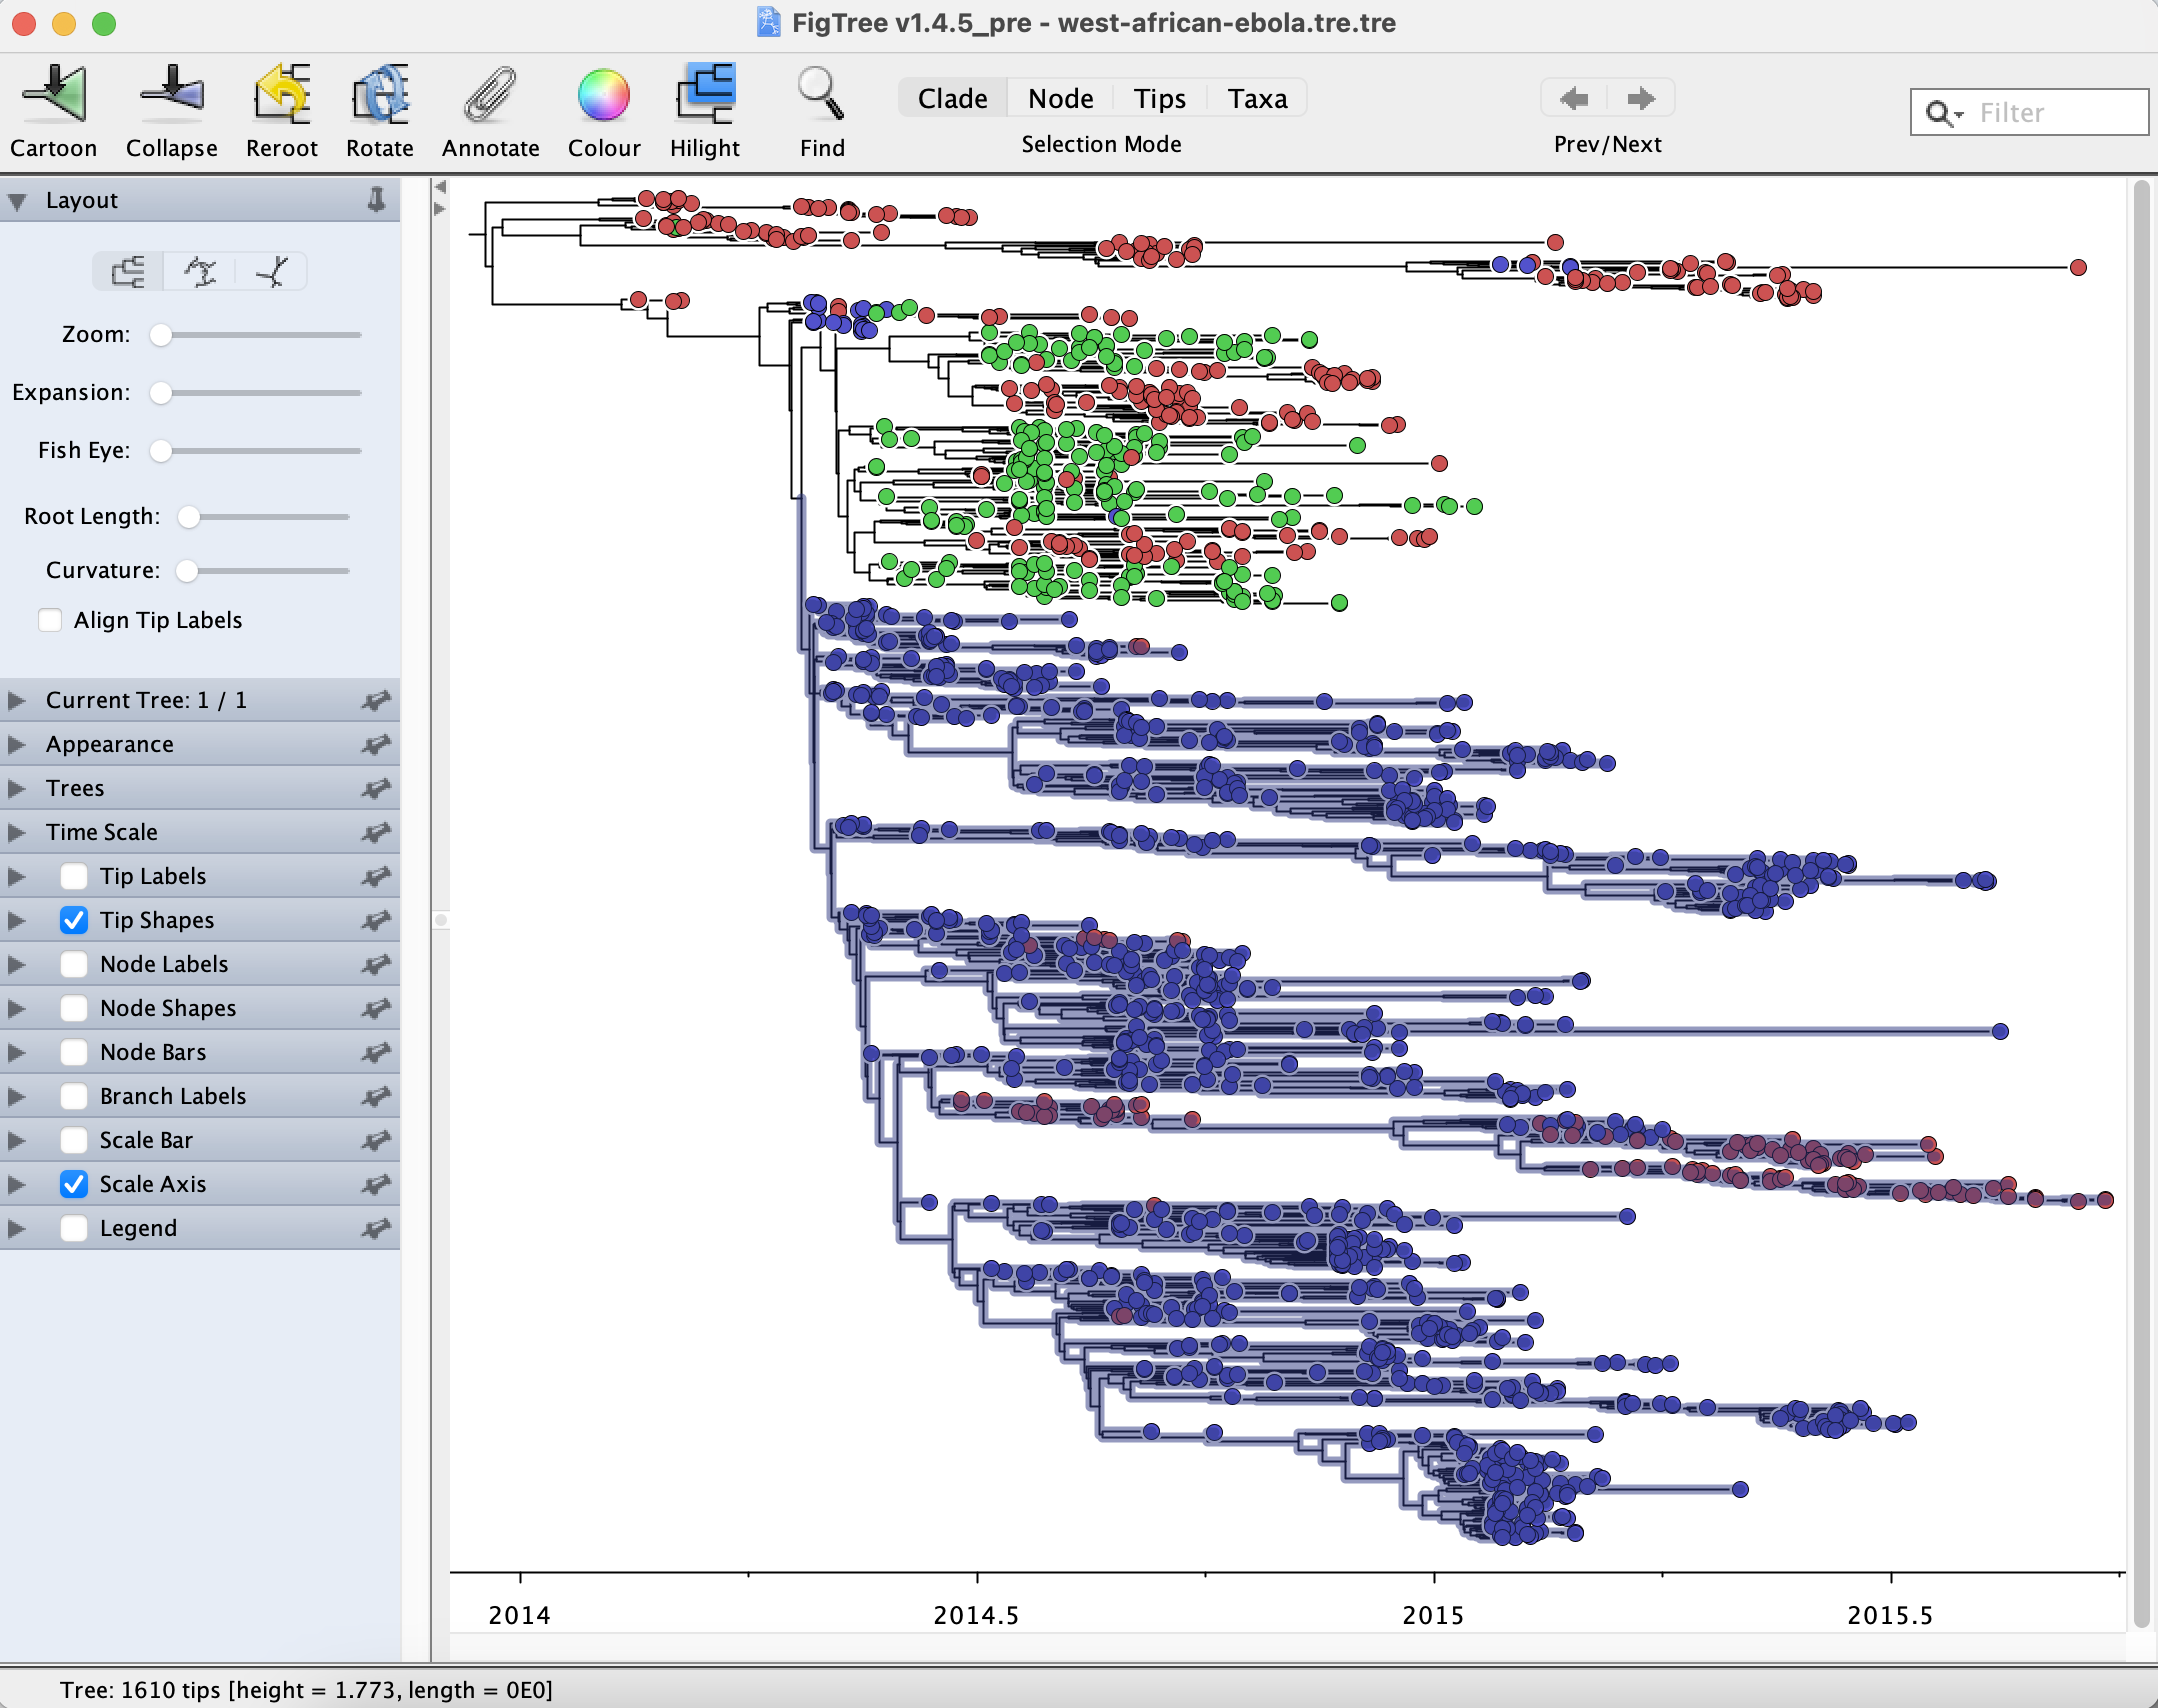
Select the largest clade in Guinea. Click the option in Highlight in the above menu and choose a colour of your preference to highlight the clade of interest. In the File menu above, select the option Save As, naming your subtree as “west-african-ebola.GUI.subtre.tre” and click the option Export as PDF. The user may also choose to Export as JPEG, Export as SVG, or Export as PNG. If needed, PDF and SVG formats can then be further prepared for publication using, for example, Adobe Illustrator or Inkscape.